Social and economic information can provide insight into the relationship between nearshore natural resources and coastal communities. This information will also inform managers during the development and implementation of management policies and actions. Nearshore marine resources directly and indirectly provide many benefits to the coastal communities, visitors, the regional economy, and more broadly to Oregon citizens. Select demographic and economic information for the Oregon coast is summarized here. The focus is on some of the trends which are likely to be relevant to nearshore resource management over the next decade.
Human communities are part of the coastal ecosystem. The coast’s environment, resources and geography affect where people live, the viability of different business opportunities, property values, and recreational opportunity availability. Feedback between the socioeconomic and ecological systems occurs in both directions. In one direction, the environmental qualities and resources of the area affect the economic base and culture of coastal communities. In turn, different types of economic systems, consumptive (e.g., fishing, mining) and non-consumptive (e.g., tourism, shipping) uses of natural resources, also influence the coastal ecosystem. Ecological understanding, public awareness, and policy initiatives will improve stewardship of the marine ecosystems. This knowledge can facilitate effective management of Oregon’s nearshore resources in order to ensure sustainable use.
Coastal Oregon History
The land and waters of the Oregon coast were the setting for a dynamic aboriginal culture characterized by natural resource acquisition at many diverse localities (Moss and Erlandson 1996). Prior to European contact, Native Americans relied predominantly on fishing, hunting, gathering, and trading for sustenance. Their natural resource utilization occurred in a wide variety of environments, including sand spits, saltwater bays, tidal and intertidal estuaries, lake shorelines, river mouths and their ocean confluences. Archeological evidence of subsistence activities can be found along the Oregon coastline in the form of shell middens, fishing weirs, food processing sites, villages, and seasonal occupation camps. The types of resources utilized were directly related to the food sources available within their geographic locale. The diets of the aboriginal people primarily consisted of salmon, shellfish, plants, and land mammals. Native cultures in general were renowned for their maritime life styles, elaborate technology, high population densities, sophisticated art and architectural traditions, and sociopolitical complexity.
Coastal Oregon is geographically separated from the rest of the state by a low-lying mountain range that parallels the coastline. This geography had a direct effect on early European settlement patterns. Numerous small homesteads sprang up along the rivers and bottomlands where subsistence agriculture was possible. Early European settlers subsisted by gathering locally available resources, growing their own food in large subsistence gardens, and maintaining the few possessions they brought with them (ICF International 2010). In addition to their gardens and livestock, they also utilized many of the same resources as the Native Americans – wild berries, deer, elk, and estuarine animals such as clams, crab, and fish. Shelter, often in the form of log cabins, was the first priority on any new land claim. As these early families became more settled, larger houses and outbuildings were constructed. While local towns played important roles in trade and commerce, most early residents continued to live in rural areas. Many of the early towns along the Oregon Coast had brief periods of prosperity before disappearing.
In the modern era, marine resource harvest has increased as human demand for food and recreation has grown, and efforts have expanded from estuary and shoreline-based activities to include nearshore and more distant waters. Wild salmon populations and some shellfish production have been supplemented with hatcheries and aquaculture operations.
General Coastal Oregon Population Data

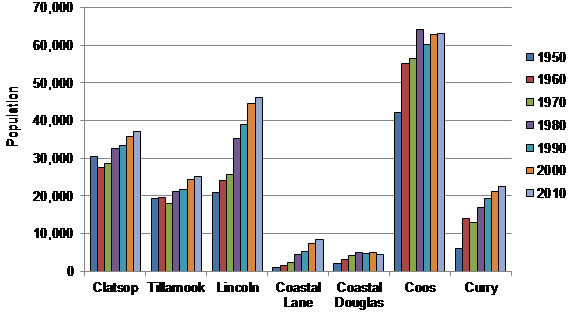
A large proportion of the land in coastal Oregon is owned by the Federal government, the state, forest products companies, and other tribal or government entities (Figure 4.1). A large majority of coastal residents still live near the coastline or in narrow coastal river valleys. Based on the total amount of land in the region, the Oregon coast is sparsely inhabited. The eastern boundaries of five counties (Clatsop, Tillamook, Lincoln, Coos and Curry) approximate the range crest, while Lane and Douglas counties extend farther east to interior valleys. The aggregate density of the five coastal counties (excluding coastal Lane and coastal Douglas counties) was 31.6 persons per square mile in 2010. While the average density is low, the density within available private land suitable for residential development is higher than these figures suggest. Timberlands are 94 percent of the land base (Campbell et al. 2002). This situation has important implications which will to be subsequently discussed. State density was 39.9 persons per square mile in 2010 (Figure 4.2).[1] Oregon is 39th in density among all states (U.S. Census 2010). State density has approximately doubled since 1960 (Wilson and Fischetti 2010). Overall, the coastal population has slowly and steadily increased since the 1930’s (Figure 4.3).

In 2000, the population of the five coastal counties was 185,460 people—about 5.4 percent of Oregon’s total population. In 2010, the population was 193,730 in the five coastal counties, which was 5.1 percent of Oregon’s total population (Table 4.1). A higher proportion of retirement-age persons lived on the coast (22.0 percent) compared to the rest of Oregon (13.9 percent) in 2010 (Table 4.1 and Figure 4.4). The population growth rate for the Oregon coast, albeit slower than the rest of Oregon, has mostly occurred as a result of in-migration of both working age adults and retirees, though the retiree population has grown more than other age groups. Lincoln, Curry and coastal Lane counties have experienced a higher influx of retirees than the other coastal counties. The coast population has disproportionately more persons older than 50 years of age, and disproportionately fewer younger individuals. There is an out-migration of young adults searching for education and employment opportunities. Population growth due to births within the coastal region has actually declined. The slower rate of growth, age structure and in-migration pattern has a large bearing on the character of the coast’s economy (Swedeen et al., 2008).
Table 4.1. Oregon, Port Group, and Selected Cities Population and Housing Characteristics in Recent Years


Coastal Oregon Economic Characteristics
Post European settlement, coastal economies were based on natural resource economic sectors in fishing, farming and logging. Opportunities in these industries generally have been declining in the last 35 years. There is considerable variation in sources of income among coastal counties. For example, Tillamook County has a large economic base from agriculture production, Lincoln County relies on commercial fishing and tourism, and timber production is still important to Coos County (TRG 2006 and 2014). The following discussion highlights the most important sectors of the regional economy.
Agriculture
Agriculture in Oregon’s coastal areas is part of a lifestyle that contributes diversity to local economies. It also helps provide a buffer to the variable nature of the forestry, fishing and recreation industries. The agriculture industry has remained consistently strong in Tillamook and Coos counties.
Timber Industry
Timber harvest was increasing into the 1980’s and has since decreased (OFRI, 2012). Tillamook and Coos Counties have experienced cyclical patterns in timber harvest, depending upon national demand for fiber and local availability of timber. However, harvest volumes and timber industry employment in these areas have generally been in decline. Coastal counties’ timberlands are 94 percent of the land base (Campbell et al., 2002). There is a mixture of federal, state, and private timberland ownership in coastal counties (Figure 4.1).
Commercial Fisheries
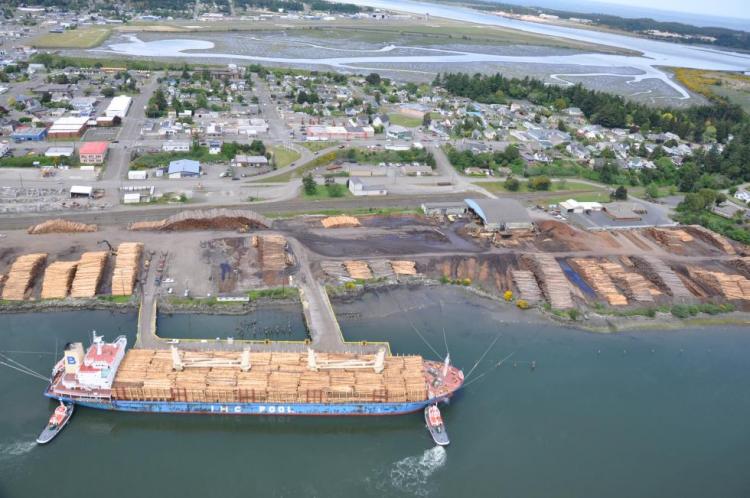
Commercial fishing ports (Figure 4.5) are an active contributor to Oregon’s statewide and coastal economy. The onshore landed component of Oregon’s commercial fishing industry contributed $286 million in personal income to the state’s economy in 2014 (Table 4.2), a three percent increase compared to the previous 10-year average. The Dungeness crab fishery alone contributed $70 million in 2014.
Many fish and shellfish move in and out of Oregon’s 3 mile nearshore boundary throughout their lifecycles. Regardless of where they are harvested, the nearshore habitat and waters are an important component of many of Oregon’s commercial fisheries including the Dungeness crab fishery, the commercial salmon fishery, coastal pelagic species fisheries (e.g., Pacific sardine, northern anchovy, etc.), the urchin fishery, clam fisheries and a variety of groundfish fisheries. Groundfish fisheries which target a variety of flatfish, roundfish, rockfish, sharks, skates and other species can be executed across the continental shelf with several gear types (trawl net, long line, trap, hook and line). Since the early 1990’s, Oregon has managed a commercial fishery composed of small vessels (averaging 25 feet) which target several rockfish species (predominantly black and blue rockfish), cabezon, and greenling in nearshore waters primarily with hook and line or longline gear. Referred to as Oregon’s “commercial nearshore fishery”, a state limited entry permit framework was implemented in 2004. There were 121 permits issued in 2014. Many of these permitted vessels also target lingcod as do open access fishery vessels using the same gear types in nearshore waters. These nearshore groundfish fisheries had an economic contribution of about $2.1 million in personal income in 2014 (Table 4.2).
Oregon’s commercial fisheries are an important contributor to local economies. Seafood buyers, processors and distributors provide a significant number of jobs in coastal ports and inland. While the majority of commercial fishery landings occur in three ports in Oregon (Astoria, Newport and Coos Bay), smaller ports on the southern coast (Bandon, Port Orford, Gold Beach and Brookings) have found a particular niche in supplying the demand for high-value live fish from nearshore waters.
Diverse and healthy ports are critical to the economic survival of fishing vessel owners and operators. Their businesses are dependent on fishing-related service businesses such as vessel dry dock facilities, mechanics, welders, refrigeration specialists, machine shops, marine electronics sales and service firms, professional services (attorneys and accountants) and marine suppliers. Particularly in Astoria and Newport, many vessel repair and provisioning businesses service and support distant water fishing activities. Fishing in areas such as the Bering Sea or North Pacific Ocean contributed more than $261 million of personal income in 2014 (Table 4.2) when this income is brought back to the state by skippers, crewmen and processor workers, and vessel/permit owners with residency in Oregon. Collectively, Oregon’s ports are supporting a vibrant maritime infrastructure while supplying the increasing demand for sustainably managed seafood to both domestic and international markets.
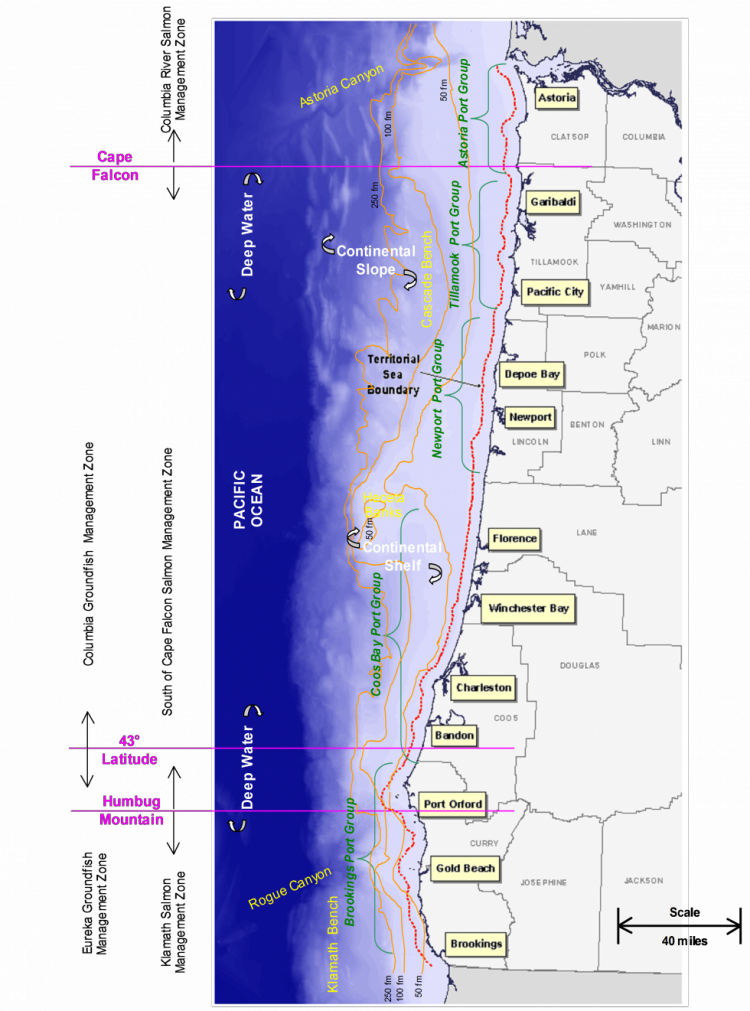
Table 4.2. Economic Contributions from Commercial Nearshore and Other Fisheries by Port Groups in 2014.

Sport Fisheries
Many ports also support sport fishing (Figure 4.5). There were over one million marine finfish fishing trips, including lower bay fishing locations, in 2012 (TRG 2013). Based on 2014 estimates of sport landing totals for bottomfishing, sport charter boat fishing was most prevalent in Newport, Depoe Bay, Charleston and Garibaldi. Private boat sport fishing activity, in terms of numbers of trips, was greatest in Brookings, closely followed by Charleston and Newport. The estimated number of angler days for all of the fisheries used to make the current year economic contribution estimates are shown in Table 4.3 and Figure 4.6. In 2012, sport trips targeting bottomfish comprised 41 percent of all ocean sport trips, but only seven percent of all ocean and bay fishing trips, which reflects the significant difference in the focus of targeting effort in the bays.
Sport fishing trips target a range of species in both nearshore waters and in offshore waters, which occur outside of the Territorial Sea (beyond 3 nautical miles). Bottomfish fisheries occur primarily in nearshore waters, while tuna fishing almost always occurs far offshore. Halibut, salmon, and other target species are pursued in both areas. All combined sport fisheries trip spending generated $49.5 million in personal income in coastal economies (Table 4.4 and Figure 4.7). Sport bottomfishing was 13.3 percent of this economic contribution. These estimates include fishing trips in nearshore waters as well as all other ocean locations. The sport bottomfish fishery is an important component of many coastal economies, as it provides stable and consistent income for these communities during times when other seasonal fisheries (e.g., salmon and tuna) are not available.
Sport crabbing and clamming in Oregon bays and nearshore waters is also popular. The bay crab fisheries were the greatest component of harvest, accounting for approximately 60 percent of the total annual sport crab harvest, with the other 40 percent caught in the ocean (Ainsworth et al. 2012). The largest clam fisheries are for razor clams and for a group of clams collectively known as bay clams (including cockles, butter clams, gaper clams, and native littleneck clams) found, as the name implies, within the state’s many bays and estuaries (Ainsworth et al. 2014). Bay clams are targeted for both sport and commercial harvest in Oregon.
Recreational fishing is a significant part of coastal economies. There is a direct link between recreational fishing, coastal tourism, and the service industry. Visiting fishermen and their families contribute substantially to local economies by purchasing licenses, fishing gear and boating accessories, as well as food, lodging and other services.
Table 4.3. Ocean and Inland Recreational Fisheries Trips (in thousands of anglers) from 2007 to 2012. Note that the Lower Columbia River mainstem spring/summer Chinook fishery includes trips in off-channel areas. Coast estuary other marine species trips most complete recent year available from RecFIN is for year 2002. The counts include trips when anadromous fish are the target species. The anadromous fish trips in 2002 based on data for “bay” waterway segments are subtracted from the RecFIN derived trip data in order to avoid double counting. It is assumed that other marine species trip counts after the subtraction do not change from 2002 in subsequent years. Lower Columbia River estuary other marine trips only available from Marine Recreational Fisheries Statistical Survey (MRFSS) data ending in Year 1999. The 1997 to 1999 three year average was assumed the trip count for subsequent years. Coast freshwater fisheries data was only available up to 2011. It is assumed trip counts do not change for 2012. Source: TRG 2013.
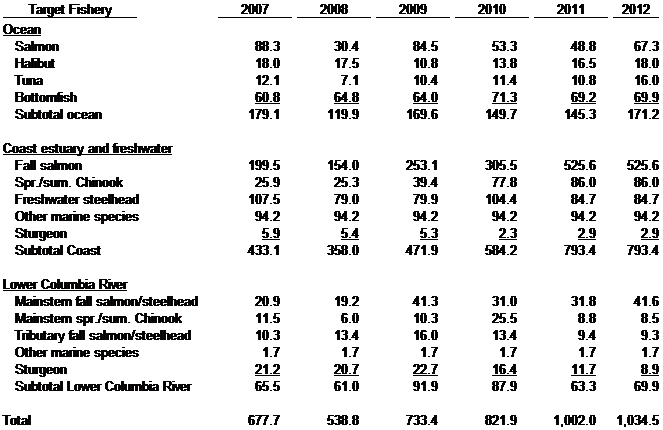
Table 4.4. Ocean and Inland Recreational Fisheries Economic Contributions in 2012. Economic contributions are expressed as personal income in millions of 2012 dollars and are at the coastwide economic level. Fall Columbia River mainstem salmon is sometimes referred to as the Buoy 10 salmon fishery. Other marine species is sometimes referred to as bottomfishing when it takes place in the ocean. Source: TRG 2013.

Coastal Tourism
Tourism is a key component of the state’s economy, and the Oregon coast is a major destination for visitors. Most coastal counties are experiencing steady growth in tourism. Visitation is increasing at state parks (White et al. 2012), and employment at motels/hotels and food service industries continues to increase.[2] The growth of tourism has served to diversify coastal counties’ economic bases.
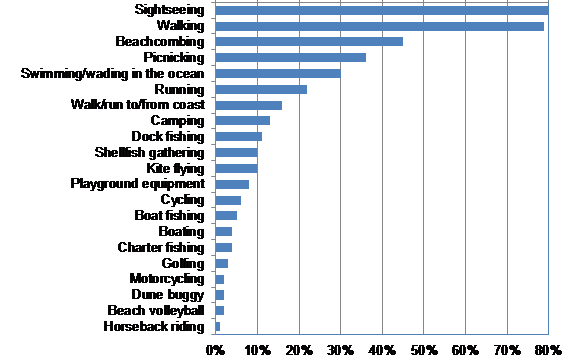
The Oregon coast marine environment attracts tourism for many experiences other than fishing. Because a trip purpose can be for more than one reason, it is difficult to measure economic contributions directly related to specific nearshore marine resources. At a more general level, the 2013-2017 Oregon Statewide Comprehensive Outdoor Recreation Plan identified ocean and beach recreational activities as the Oregon population’s fourth highest outdoor recreation activities in 2011 (OPRD 2013). Half of Oregon’s households visited the Oregon coast in 2010 (LaFranchi and Daugherty, 2011). A study published almost two decades earlier (Rettig 1989) reported on the diverse motives for Oregon coast tourism visitation and various activities in which visitors participated (Figure 4.8). The two studies (Rettig 1989, LaFranchi and Daugherty 2011) provided similar information with roughly 10% or fewer coastal visitors reportedly participating in fishing activities (Figures 4.8 and 4.9).
Wildlife viewing generates more regional economic contributions than recreational hunting and fishing activities combined in Oregon (USFWS 2008). At almost $1.7 billion, Oregon ranked in the top ten states in the nation for economic output related to wildlife viewing in 2011, with an estimated 1.44 million wildlife watchers (USFWS 2014). Although these numbers were not broken down by specific activities within regions within the state, earlier studies provide some insights.Total generated expenditures on the coast were nearly $160 million in 2008 (Dean Runyan Associates 2009). Statewide wildlife watching per trip expenditures were estimated at $66 per day (USFWS 2014). For whale watching alone, O’Connor, et al. (2009) reported that more than 375,000 tourists participated on the Oregon coast in 2008, resulting in nearly $1.6 million in direct expenditures and an additional $28.2 million in indirect expenditures. This was more than a two-fold increase in direct expenditures over 10 years (O’Connor et. al. 2009). LaFranchi and Daugherty (2011) also describe the positive economic effects of non-consumptive uses of coastal resources. It is clear that non-consumptive use of the nearshore marine ecosystem is a significant tourism driver. Non-consumptive recreational users of the nearshore ecosystem have been described as a renewable resource for Oregon’s coastal communities because of their important economic and cultural contributions (Eardley and Conway 2011).

Restoration and Protection Projects
Conservation protection and restoration projects have economic benefits. Some of the benefits are identifiable and can easily be measured. For example, agency and contractor labor and materials/services payments for management and construction projects will be re-spent in communities generating economic activity that will include the “multiplier” effect. Knowledge about the payments and their source, coupled with economic input-output modeling procedures, provide the measurements. Other benefits are more tenuous to trace and economic effects are more difficult to estimate because they will not have such direct connections to the market place. Economic benefit analysis would require extensive on-site knowledge of biological, ecological, and physical process interrelationships as well as clever ways to assess human appreciation of the setting and interrelations to formulate economic benefit estimates. A growing body of literature describes these tenuous economic benefits in terms of ecosystem services (Heal et.al 2005, Fisher et.al. 2009). It is recognized that the natural environment provides ecosystem services that increases individual welfare, but quantifying a measure of change is difficult. Economic benefit studies of conservation and restoration projects generally provide economic impacts of a defined activity but only acknowledge the broader social values.
There are several examples of economic benefits analysis studies for Oregon coastal communities. It was of interest to stakeholders to know the economic effects in Port Orford that occurs from establishing the Redfish Rocks Marine Reserve. A study found that ongoing and instigated research, planning, and management activities were adding about one-third more of the existing commercial and recreational fishing to the area’s marine related economic effects (TRG 2013). It was known that the activity was taking place, but the magnitude was a surprise to local officials. Another study reviewed the economic benefits of a salmon habitat restoration project on the lower Coquille River (Sheeran and Hesselgrave 2012). It was a more typical analysis of a restoration project whereby short-term restoration project supervision and construction as well as long-term recreation and commercial fishing economic impacts were included.
Protected and restored environments can promote economic development and reduce the need for state and federal intervention in land uses to protect environments. People are attracted by the use benefits (e.g. fishing, hunting, surfing, wildlife viewing) and the sense of increased individual welfare. Environmental stressors often accompany economic development. The stresses span coastal ecosystem elements and have cumulative impacts (Crain et al. 2008). The challenge is to understand how to best manage and mitigate these impacts. Emerging conservation practices such as ecosystem-based management that accounts for ecosystem service valuation hold substantial promise for protecting coastal marine systems (NatureServe 2015). Carrying out the practices will require a combination of public and private initiatives for success. Ecological understanding, public awareness, and policy initiatives will improve stewardship of the marine ecosystems. This knowledge can facilitate effective management of Oregon’s nearshore resources in order to ensure sustainable use.
Other Regional Export Income
In some coastal areas, many small manufacturing and service companies export their products outside the region, which also contributes to local economic growth. Industries such as boat building and water-transportation occur in the region. Lincoln County has a growing marine technology economic sector (TRG 2014). High amenity areas such as the Oregon coast also tend to attract “footloose” entrepreneurial businesses, economic activities which are not dependent on the specific location’s resources for viability. As such, writers, artists, computer hardware and software developers, and other small coastal entrepreneurs sell products outside the coastal area and bring income into regional economies. The cumulative economic contribution of these smaller industry sectors is important along the coast.
Real Estate Investment and Development
Real estate development often occurs in tandem with tourism development in high amenity locations. In the state of Oregon, 3.3% of all homes are vacant second homes (Table 4.1). In contrast, 54% of all homes are vacant second homes in Cannon Beach; 34% of all homes in Tillamook County are vacant second homes, as are 25% of all homes in Lincoln County. This rate of investment in second homes throughout the coast has significant impacts on both housing affordability and availability. Should a substantial portion of these investors retire to these second homes during the next decade, the cultural, social and political dynamics of many coastal communities will be affected.
Coastal Oregon Employment and Retirement Characteristics
Coastal Oregon is far more dependent on employment income from tourism and natural resources than the rest of the state. Coastal Oregon counties have 24% fewer persons employed in higher paying management, business and science occupations than the state average (28% /37% ), and 30% more persons involved in service and natural resource occupations ([23% + 12%] / [18% + 9%]) than the state average (Table 4.5). Table 4.6 further highlights the coastal economic dependency on tourism and natural resource industries. Twenty percent of coastal employment is in the natural resource and tourism (arts, entertainment, and accommodations) industries compared to the state average (thirteen percent). The combined state average for employment in manufacturing, professional, education, health care and education sectors is 44%, in comparison the coastal average is 34% in these sectors. In particular, there are fewer persons employed in education and health care on the coast. Among the coastal counties, Tillamook County has fewer service jobs and more natural resource jobs.
Coastal Oregon is also more dependent on retirement income than the rest of the state. During the period from 2004 to 2013, the number of jobs (full and part time) overall in the state of Oregon increased almost 6% (Table 4.7). During that same time frame, the number of jobs actually decreased nominally (<1%) on the coast. This occurred despite the fact that the coastal population grew over that time period (Figure 4.3). An important reason for this disparity between number of jobs and coastal population growth is illustrated by data related to coastal retirement patterns. As previously mentioned, the coast has proportionally fewer persons under age 49 than both the United State and the state of Oregon, and a substantially higher proportion of persons of retirement age (Figure 4.4). Retirement income is derived from investments and transfer payments (social security).[3] Over half (51%) of personal income on the coast is derived from investments and transfer payments (Figure 4.10). This is 31% higher than the state average, and 46% higher than the proportion of personal income derived from investments and transfer payments at the national level. This dependence on retirement income increased across all coastal counties between 2003 and 2012 (Figure 4.11). Much of the improvement in average coastal income during this time frame reflects retirement migration patterns, and thus household income from sources other than earned income among working families (Figure 4.12). A large proportion of the baby boom generation has yet to retire, so these trends are not likely to abate during the next decade.
Table 4.5. Civilian Employment by Occupation.

Table 4.6. Civilian Employment by Industry.
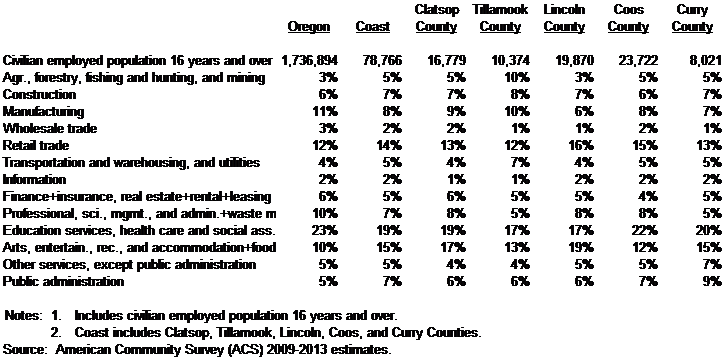
Table 4.7. Total Full-Time and Part-Time Employment (Number of Jobs) in 2004 to 2013


[1]. Unless otherwise noted, the presented demographic data are from the U.S. Bureau of Census decennial census 2010 information or the American Community Survey (ACS) aggregations for 2008-2012.
[2]. ACS tourism data were used for estimating this trend. The included North American Industrial Classification System industry categories are in a satellite account titled Arts, entertainment, recreation, accommodation, and food services. See Zemanek (2014) for an explanation of the accounting.
[3]. Transfer payments of social security benefits include SSI (disability) income.